System Requirement Specification
The biggest chapter, and the one that carries the finding. Survey answers go in at the top, and a specification for a system comes out at the bottom.
This is the chapter that turns evidence into a design. Survey answers go in at the top. A specification for a system comes out at the bottom, and every requirement can be traced back to the number that caused it.
Pages 46 to 86, the longest chapter in the thesis. Take it in five stages and it becomes easy.
The five stages of this chapter
- Who the system is forStakeholder analysis. The profile of the 40 organisers and the 64 travellers.
- Whether the measurements are trustworthyReliability, purification, dimensionality. This comes before any result.
- What the numbers sayDescriptives, correlation, regression, hypothesis testing.
- What the words sayThematic analysis of the free-text answers, which independently confirms the numbers.
- What the system must therefore doThe design mandate, the diagrams, the architecture, and 23 numbered requirements.
Stage 1. Who the system is for
The 40 organisers
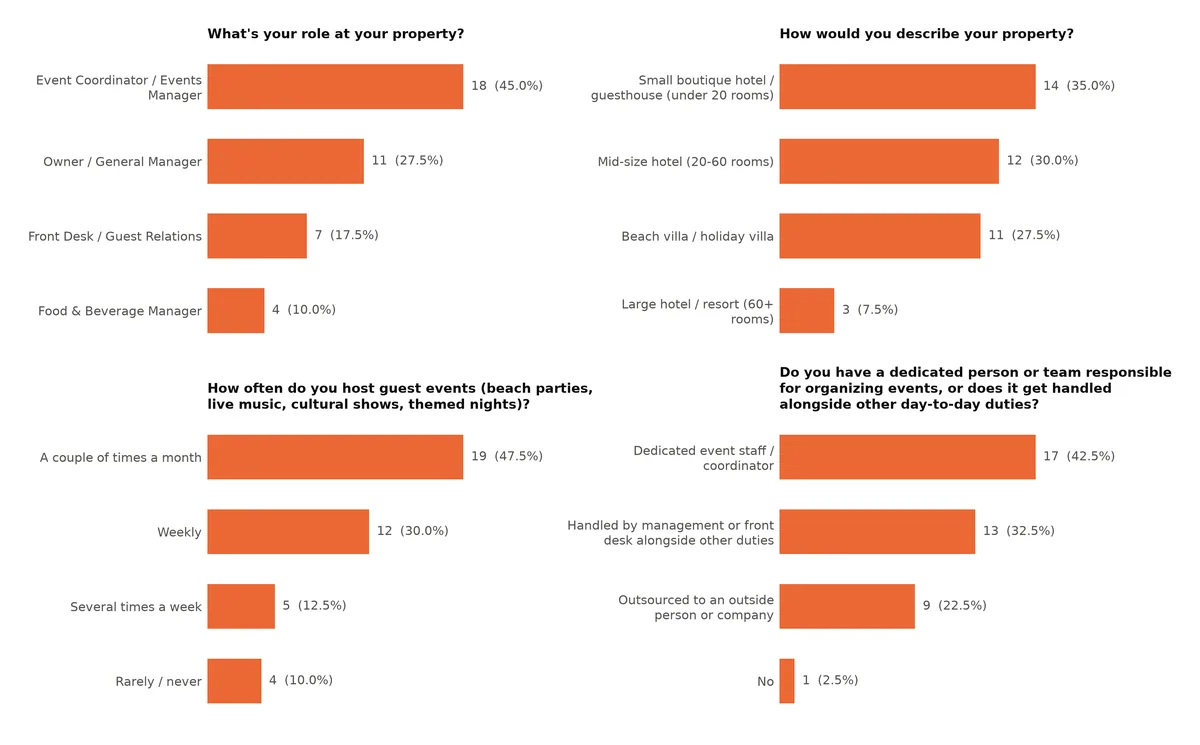
Who answered: 45.0 percent were event coordinators or events managers, 27.5 percent owners or general managers, 17.5 percent front desk or guest relations, 10.0 percent food and beverage managers.
What kind of property: 35.0 percent boutique hotels and guesthouses under 20 rooms, 30.0 percent mid-size hotels of 20 to 60 rooms, 27.5 percent beach or holiday villas, and only 7.5 percent large hotels and resorts.
42.5 percent have dedicated event staff. The other 55.0 percent either handle events alongside other duties or outsource them. Only 1 respondent said there is nobody at all.
So for most properties, running an event competes with other work. That single fact limits how complicated the system is allowed to be, and it is why NFR-06 says a first-time organiser must be able to publish an event without any training material.
The 64 travellers
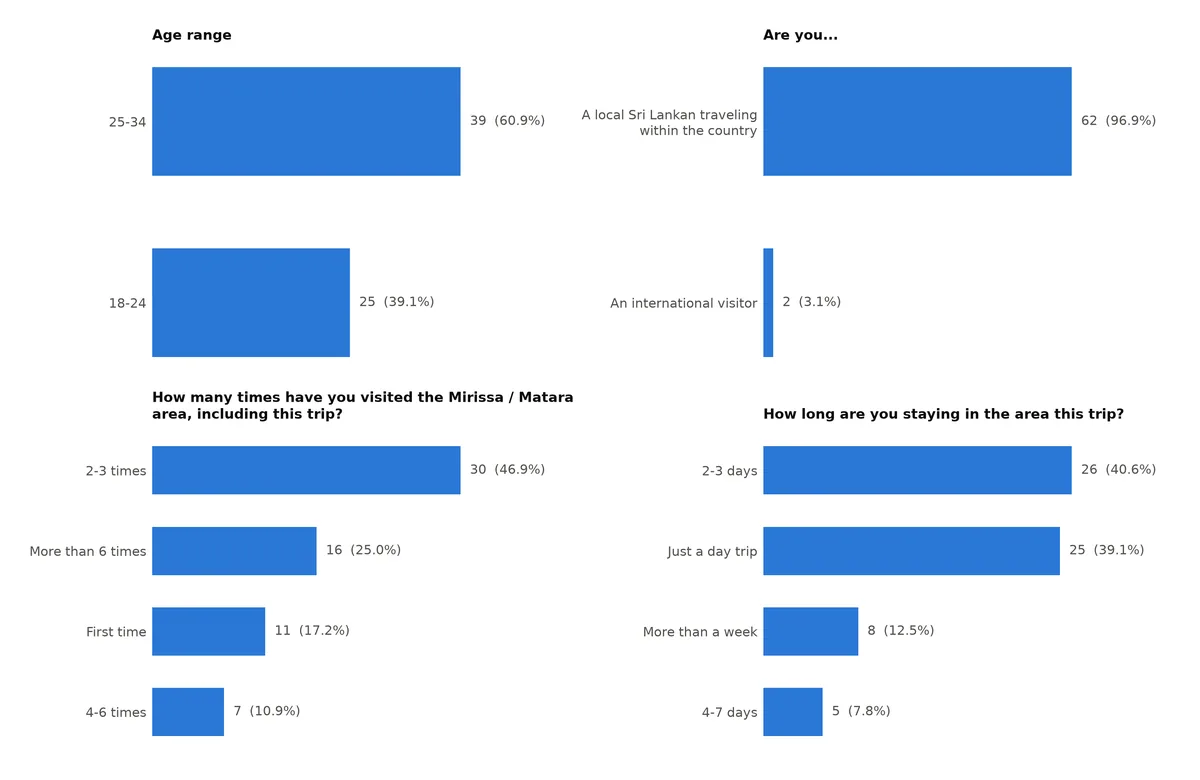
Only 2 of 64 respondents were international visitors, and every single respondent was between 18 and 34.
What that means: your traveller findings generalise to the domestic young-adult traveller segment, not to the international visitor population that Chapter 1 also identified. Say that boundary yourself before anyone asks.
The follow-up is already written in Chapter 7. Replicating with international visitors is a named future recommendation, and the expectation is that centralised information matters more for travellers with less local knowledge, not less.
Question 14 on both surveys is not part of any scale. It exists only to show the problem actually happens.
37 of 40 organisers, that is 92.5 percent, had an event run short-staffed or short-stocked at least sometimes. Only 1 said never.
53 of 64 travellers, that is 82.8 percent, had changed plans last minute because something at an event was unavailable when they arrived.
If someone says "is this a real problem or a hypothetical one", those two numbers are your answer.
Stage 2. Are the measurements trustworthy?
This stage comes before any finding, and the order is deliberate. If the questions do not hang together, nothing after them means anything.
What went wrong, and what was done about it
Two questions failed. Both of them were the deliberately reversed ones, item 7 and item 20, and they failed in both samples.
Most questions are written so that agreeing means "yes, this is a problem for me". A reversed question is written the other way round, so that agreeing means "no, this is fine". Then you flip its score before analysis.
The purpose is to catch people who tick 5 down the whole page without reading.
After flipping, both reversed items correlated negatively with their own group. In plain terms: people answered them in line with the other questions rather than against them, which means the reversal did not register.
| Group | Sample | Alpha before | Removed | Alpha after |
|---|---|---|---|---|
| IV1 | Tourist | 0.502 | Q7 | 0.789 |
| IV1 | Organizer | 0.425 | Q7 | 0.691 |
| IV2 | Tourist | 0.802 | none | 0.802 |
| IV2 | Organizer | 0.665 | none | 0.665 |
| IV3 | Tourist | 0.868 | none | 0.868 |
| IV3 | Organizer | 0.758 | none | 0.758 |
| Outcome | Tourist | 0.540 | Q20 | 0.886 |
| Outcome | Organizer | 0.159 | Q20 | 0.690 |
Table 4.3 in your thesis. Notice that the two groups with nothing removed did not need removing. Only the two reversed items failed.
Someone will point at that number and ask how it could possibly be acceptable.
The answer: it is not acceptable, and it was not accepted. That is the figure before purification. One reversed item, question 20, correlated at minus 0.623 with its own group. Removing it by the standard 0.30 rule lifted the group to 0.690.
Both the before and the after are printed in Table 4.3, because showing only the final number would hide the diagnostic step that made the scale trustworthy in the first place.
Why it is a known artifact, not bad data
This is the strongest part of the defence. Three pieces of evidence:
- It hit exactly the two reverse-worded items on each instrument and nothing else. Every forward-worded item behaved normally.
- It happened the same way in two independently recruited samples.
- There is published research documenting this. Negatively worded items often load onto a separate "method factor" rather than the thing they were written to measure, especially where people answer in a second language or at speed.
Item 7 measured satisfaction with existing promotion methods. Item 20 measured hesitancy about adopting a new platform. Both are still reported descriptively, and both reappear in the thematic analysis, where organiser caution about reliability, security and cost comes through clearly.
They are excluded only from the scored scales that go into the regression.
One more check: does each group measure one thing?
Principal component analysis was run on every purified group. Every single one returned exactly one strong result, which means each construct can legitimately be averaged into a single score.
Chapter 3 defined Coordination Effectiveness as having three sub-parts: Operational Performance, Decision-Making Accuracy and Booking Confidence.
The data showed the surviving questions behaving as one single thing, not three separable ones.
So it is scored as one composite, and the three sub-parts are kept as ideas rather than as separately scored subscales. Chapter 7 recommends a longer instrument with enough questions per sub-part to test them properly. Do not pretend you measured three things.
Stage 3. What the numbers say
The averages
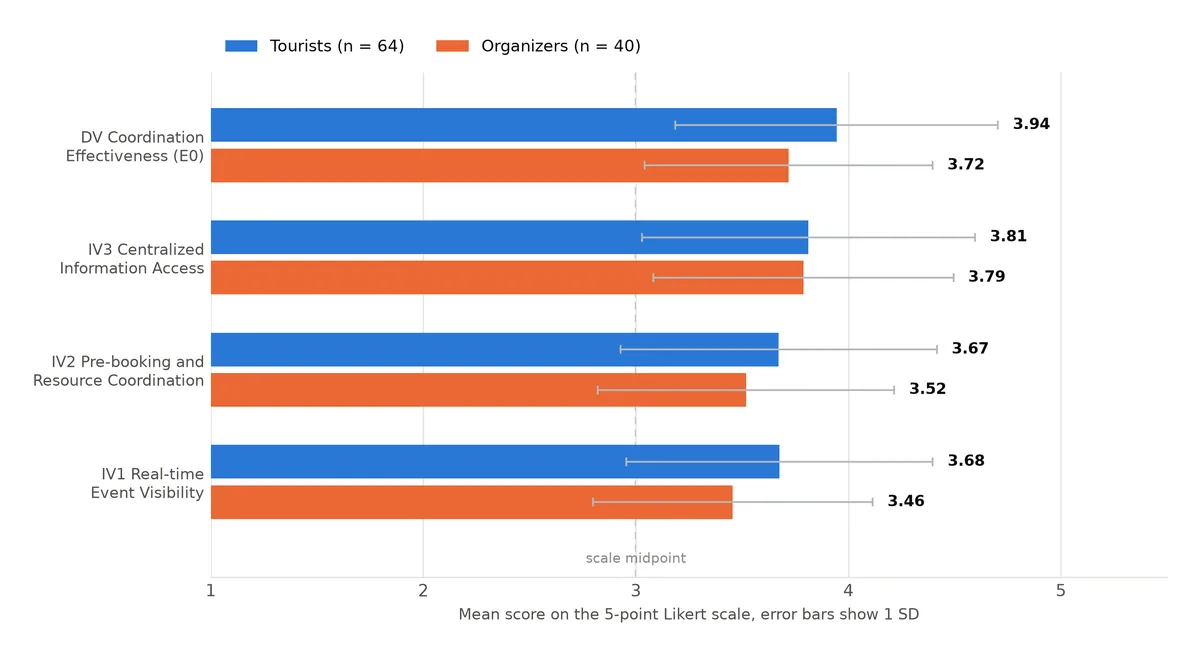
Everything sits above the 3.00 midpoint in both samples, which means both sides of the market recognise the problem and want the fix.
| Construct | Tourist mean | Organizer mean |
|---|---|---|
| IV1 Real-time Event Visibility | 3.676 | 3.456 |
| IV2 Pre-booking and Resource Coordination | 3.672 | 3.519 |
| IV3 Centralized Information Access | 3.812 | 3.788 |
| Outcome, Coordination Effectiveness | 3.945 | 3.719 |
Two patterns worth noticing. IV3 is the highest of the three causes in both samples, so information fragmentation is the most strongly felt problem. And the outcome is the highest of all four in both samples, which means willingness to adopt is strong on both sides.
The correlations, where all three look strong
| Relationship | Tourist r | Organizer r | Strength |
|---|---|---|---|
| IV1 with the outcome | 0.571 | 0.580 | Strong |
| IV2 with the outcome | 0.677 | 0.633 | Strong |
| IV3 with the outcome | 0.809 | 0.683 | Very strong |
Every one is positive and statistically significant. And the rank order is identical in both samples, which on its own is a striking result, because these were two independently recruited groups answering parallel questionnaires.
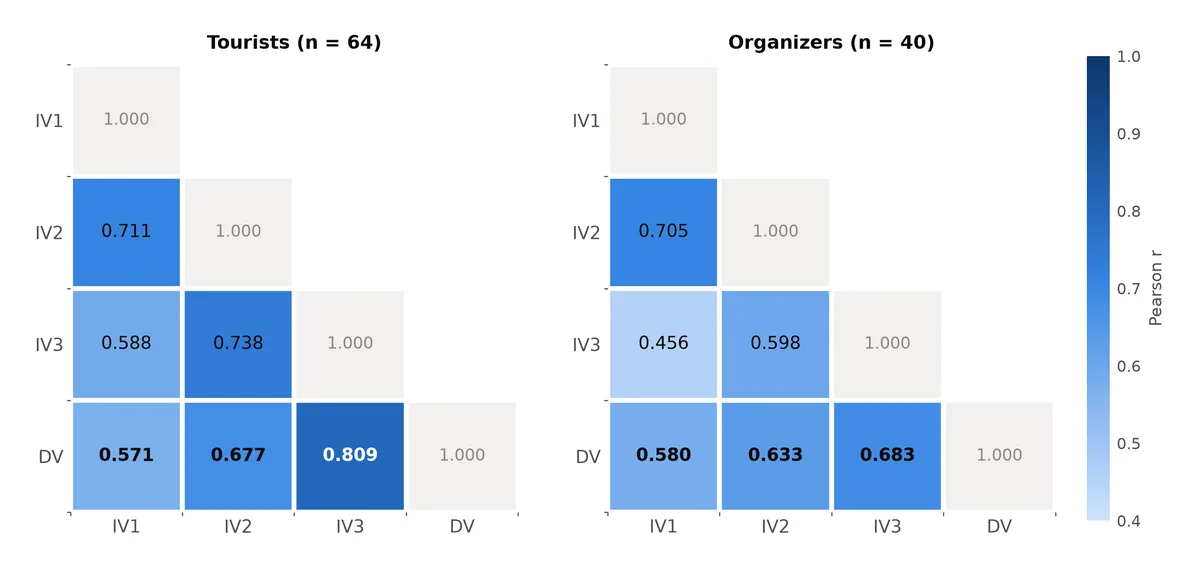
The three causes are also heavily correlated with each other. IV2 and IV3 sit at 0.738 among travellers.
That overlap is what the next step untangles, and it is the whole story of this chapter.
The regression, where the truth comes out
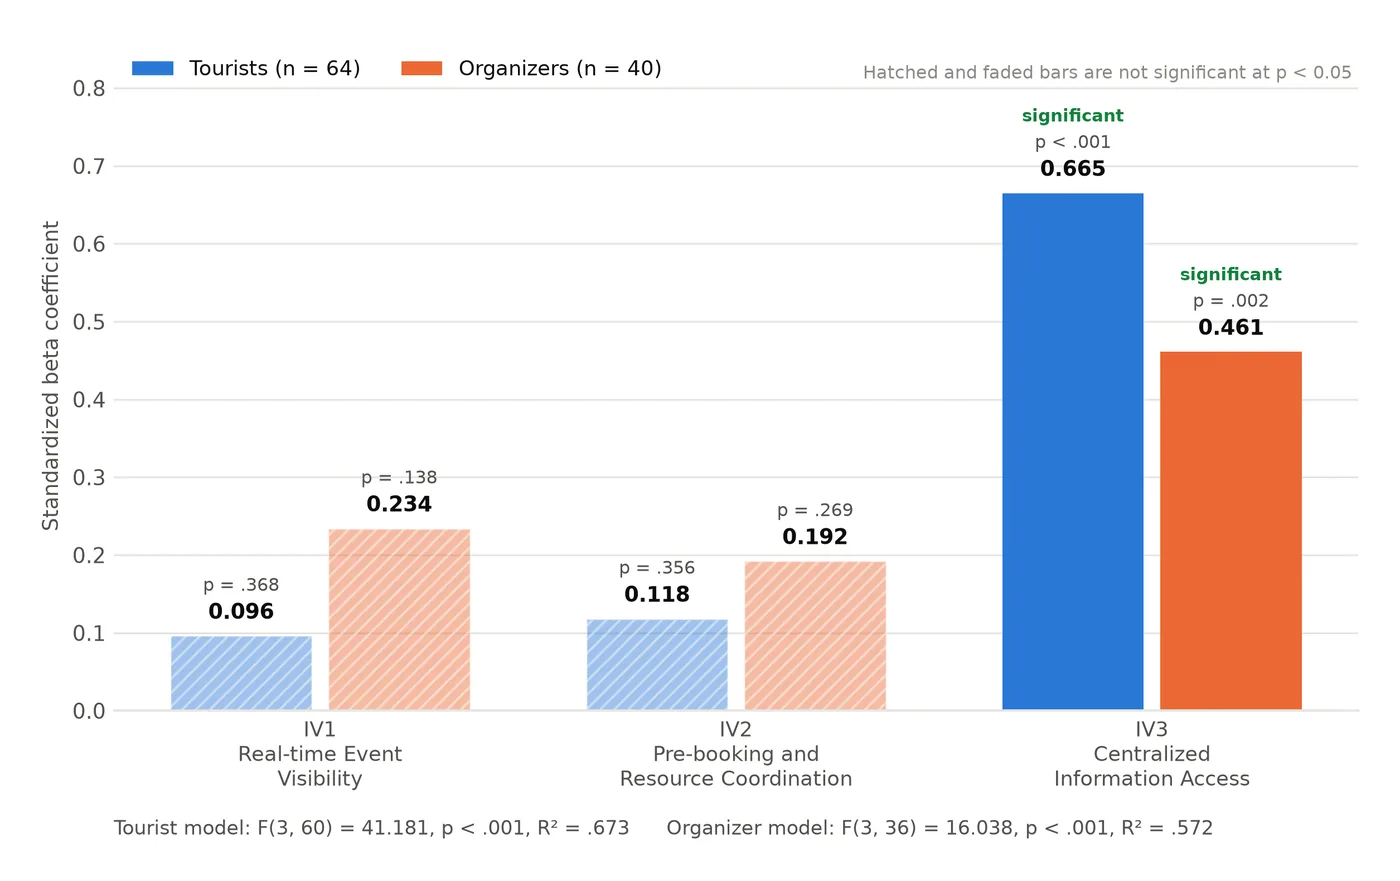
All three causes were entered into the model together, and the analysis was run separately on each sample. That gives two independent tests of the same idea.
| Predictor | Tourist beta | Tourist p | Organizer beta | Organizer p |
|---|---|---|---|---|
| IV1 Real-time visibility | 0.096 | 0.368 | 0.234 | 0.138 |
| IV2 Pre-booking | 0.118 | 0.356 | 0.192 | 0.269 |
| IV3 Centralized information | 0.665 | < 0.001 | 0.461 | 0.002 |
| Model | R squared | F | p | Durbin-Watson | Highest VIF |
|---|---|---|---|---|---|
| Tourist, n = 64 | 0.673 | 41.181 | < 0.001 | 2.165 | 2.959 |
| Organizer, n = 40 | 0.572 | 16.038 | < 0.001 | 1.617 | 2.462 |
Both models are significant overall, and both pass their assumption checks. VIF under 5 and Durbin-Watson inside 1.5 to 2.5.
Why the correlations and the regression disagree
All three causes correlate strongly with the outcome. But they also correlate strongly with each other.
When all three go into the model together, the part of the outcome that IV1 and IV2 explain turns out to be mostly the same part that IV3 explains. So the credit goes to IV3.
The meaning is not that visibility and pre-booking do not matter. It is that they matter through unified information rather than independently of it.
So a platform that offers live listings and a booking button, without unifying the record behind them, has built the two capabilities that carry no unique effect and skipped the one that does.
The verdict on the three hypotheses
H1 Not supported
Real-time visibility. Beta 0.096 with p 0.368 among travellers, beta 0.234 with p 0.138 among organisers.
H2 Not supported
Pre-booking. Beta 0.118 with p 0.356 among travellers, beta 0.192 with p 0.269 among organisers.
H3 Supported, twice
Centralized information access. Beta 0.665 with p below 0.001 among travellers, beta 0.461 with p 0.002 among organisers.
One. The traveller model is underpowered for detecting small effects at n equals 64. So the non-significant results mean we failed to detect a unique effect, not there is no effect. Your thesis says this explicitly and you should too.
Two. The organiser coefficients for IV1 at 0.234 and IV2 at 0.192 are large enough that they would plausibly reach significance in a bigger sample. The firmly supported claim is the positive one: IV3 dominates in both independent samples.
Stage 4. What the words say
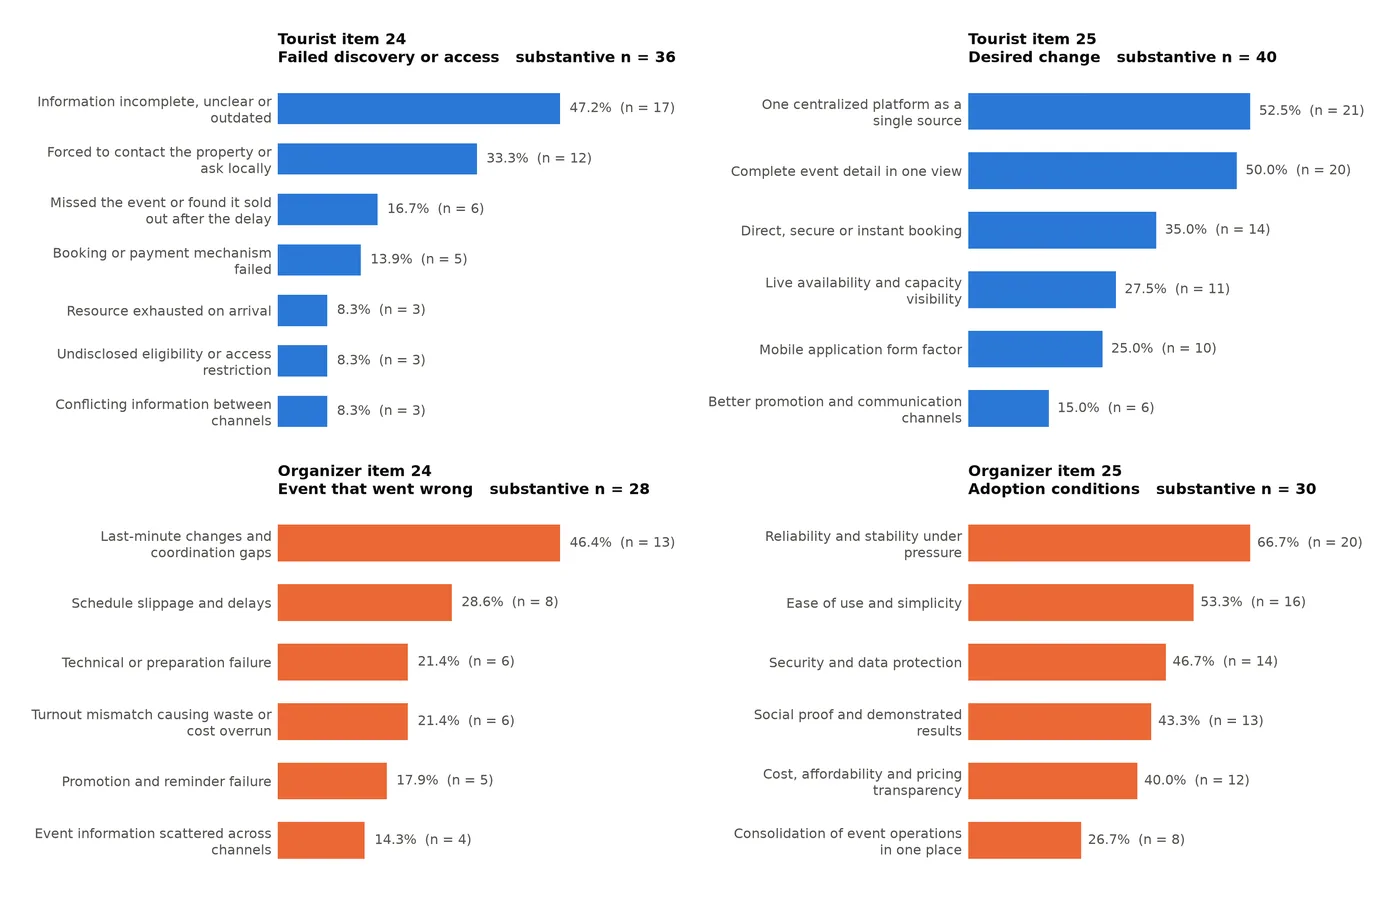
Items 24 and 25 on each survey were free text. They were analysed with the six-phase thematic analysis method, and the result independently confirms the statistics.
Blank answers, answers under 15 characters, and non-answers like "no" or "nothing" were excluded and reported separately rather than counted as silence.
So every percentage below is of substantive responses, not of all 64 or all 40. If someone asks "47.2 percent of what", that is the answer. One answer can carry more than one theme.
| Theme | Who, and which question | Share |
|---|---|---|
| Information incomplete, unclear or outdated | Travellers, what went wrong | 47.2% |
| Forced to contact the property directly or ask around | Travellers, what went wrong | 33.3% |
| Missed the event, or found it sold out after the delay | Travellers, what went wrong | 16.7% |
| One centralized platform as a single source | Travellers, what would you change | 52.5% |
| Complete event detail in one view | Travellers, what would you change | 50.0% |
| Direct, secure or instant booking | Travellers, what would you change | 35.0% |
| Last-minute changes and coordination gaps | Organisers, what went wrong | 46.4% |
| Schedule slippage and delays | Organisers, what went wrong | 28.6% |
| Turnout mismatch causing waste or cost overrun | Organisers, what went wrong | 21.4% |
| Event information scattered across channels | Organisers, what went wrong | 14.3% |
The dominant traveller complaint is not that events go unadvertised. It is that the information that exists is incomplete, unclear or out of date.
That changes the whole framing of the problem. The deficit is one of information integrity, not information volume. You do not need more announcements. You need one announcement that can be trusted.
The adoption conditions, which became your requirements
Question 25 on the organiser survey asked what would make them adopt a platform, or stop them. The answers turned directly into your non-functional requirements. This is how a feeling becomes something testable.
| Condition | Share | Became |
|---|---|---|
| Reliability and stability under pressure | 66.7% | NFR-01 page speed, NFR-03 operable under load |
| Ease of use | 53.3% | NFR-06 publish without training material |
| Security and data protection | 46.7% | NFR-05 access control at the database |
| Proof from other operators first | 43.3% | The launch strategy in Chapter 7 |
| Cost and pricing transparency | 40.0% | NFR-08 no per-property licence cost |
Stage 5. What the system must therefore do
The design mandate
Because IV3 is the only unique predictor in both samples, centralized information access is not one desirable feature among three. It is the mechanism through which the other two deliver value.
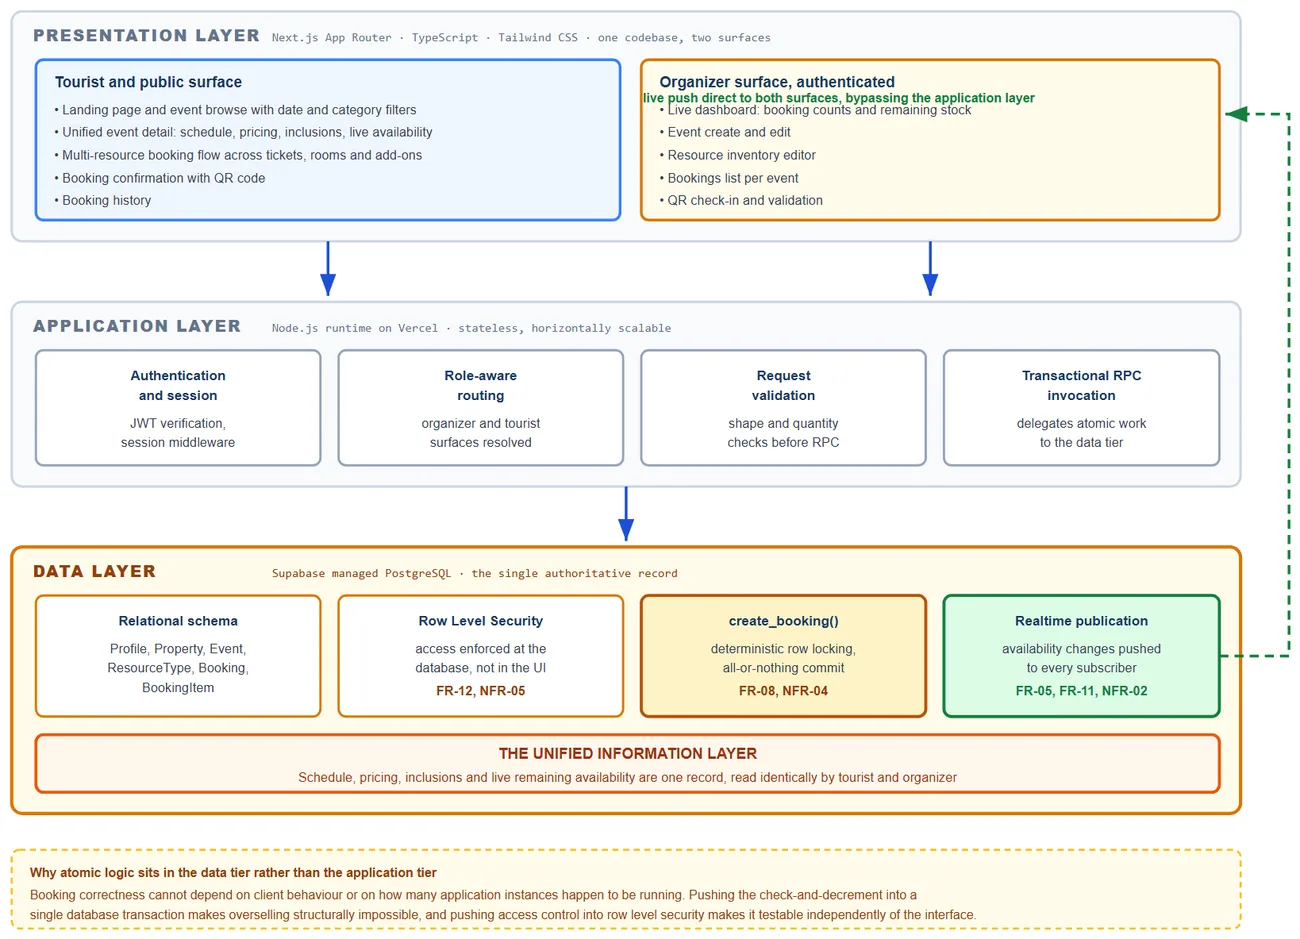
So the requirement set treats the unified information layer as the architectural core. Real-time visibility is specified as a read surface over that record. Pre-booking is specified as the write path into it.
Meaning: a booking made by a traveller immediately and necessarily changes the availability figure that both parties see. That is the finding expressed as an architecture.
The free-text answers sharpen it in three ways:
- Because staleness rather than absence is the primary failure, the requirement is for live-derived availability, not a status note the organiser types in and forgets.
- Because the information failure happens during events and not only while planning, the organiser view must be operational and live, not a report that runs overnight.
- Because adoption is conditional on reliability, simplicity, security, proof and cost, those become specified and testable requirements rather than generic quality talk.
The diagrams
| Diagram | What it shows |
|---|---|
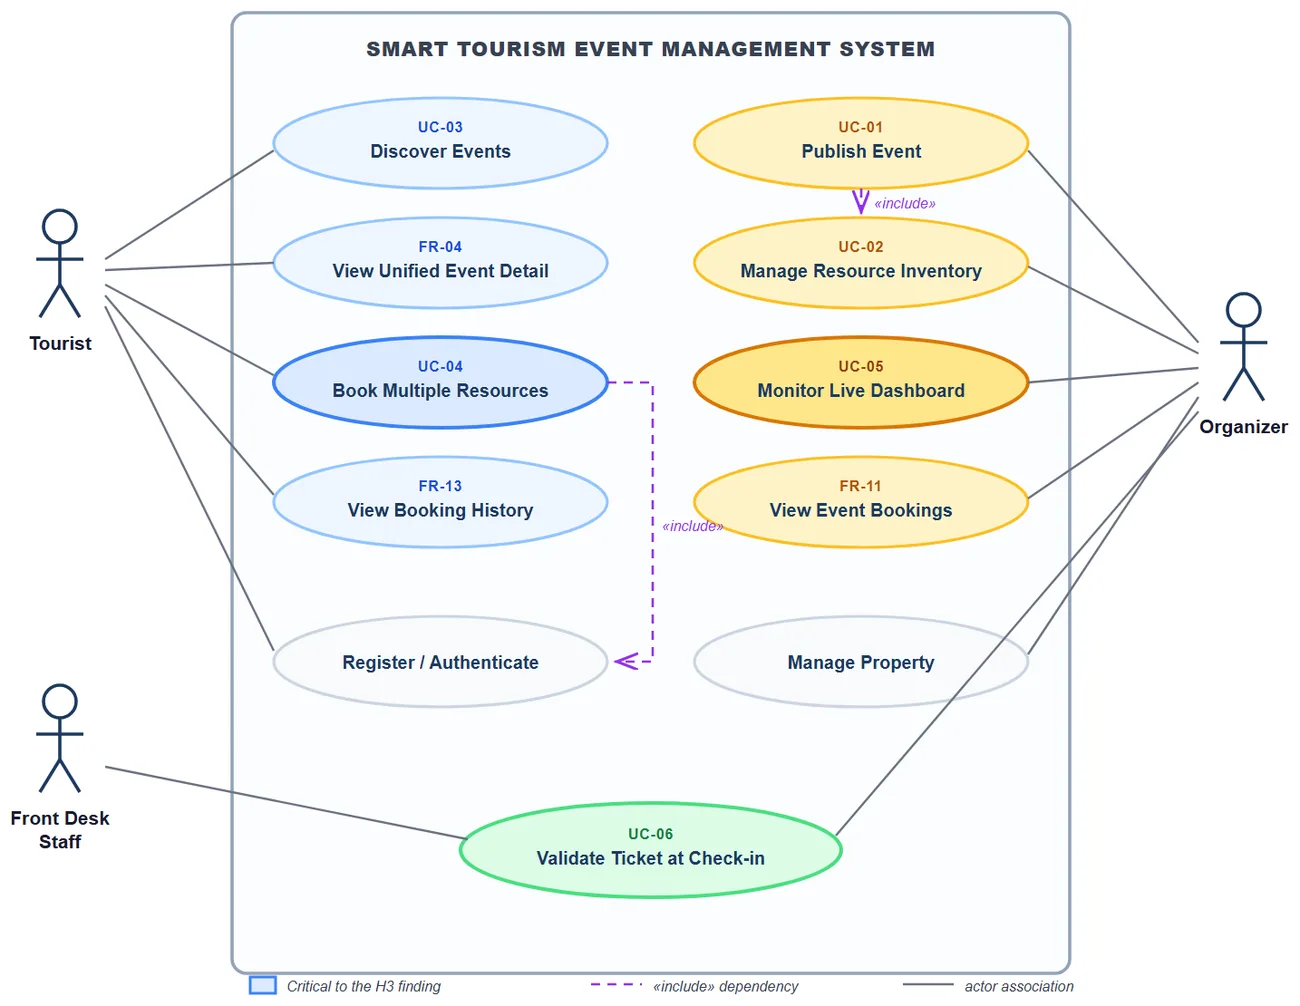
| Use case, Figure 4.7 | 3 actors, Organizer, Tourist and Front Desk Staff, and 11 use cases. Six specified in full, the rest in Appendix C. |
| Class, Figure 4.8 | 6 entities. This is the important one, because it is where tickets, rooms and add-ons become a single entity. |
| Activity, Figures 4.9 and 4.10 | The two workflows: an organiser publishing an event, and a traveller discovering and booking. |
| Sequence, Figures 4.11 to 4.13 | Booking with concurrency control, live availability propagation, and QR validation at check-in. |
| Deployment, Figure 4.14 | Three nodes, none of them self-managed, which is a direct answer to the cost constraint. |
| Architecture, Figure 4.15 | Three layers around one data store. |
The requirements
14 functional and 9 non-functional, each traced to its evidence. Four functional ones are marked critical, and they are the four that implement the finding.
| ID | The critical four | Traced to |
|---|---|---|
| FR-04 | Each event is presented as a single unified record containing schedule, pricing, inclusions and live availability | H3 supported in both samples, traveller theme at 50.0 percent, organiser item 18 at mean 3.875 |
| FR-05 | Live remaining availability per resource, derived from committed bookings and never maintained by hand | Traveller theme on staleness at 47.2 percent |
| FR-08 | Concurrent bookings shall not oversell any resource. A booking that cannot be satisfied in full commits nothing | Concurrency control requirement from the literature |
| FR-11 | Organisers see a dashboard with live booking counts and remaining stock, with no manual refresh | Organiser items 16 and 17 at means 3.800 and 3.900, coordination theme at 46.4 percent |
They are the minimum set without which the artefact would not be testing the hypothesis the study actually supported. Everything else is useful. These four are the research.
Numbers from this chapter
If they ask you
Your correlations support all three hypotheses. Why did you report the regression instead?
Because correlation asks whether two things move together, and regression asks what each one contributes once the others are accounted for. My three predictors overlap heavily, with IV2 and IV3 correlating at 0.738 in the tourist sample, so at the bivariate level each predictor gets credit for variance it shares with the others.
The regression is the test that distributes that credit correctly. Reporting only the correlations would have supported all three hypotheses handsomely and would have been misleading, and Section 7.3 says explicitly that the temptation to do that was resisted.
Your organiser alpha was 0.159. How is that acceptable?
It is not, and it was not accepted. That figure is before instrument purification. One reverse-coded item, item 20, returned a corrected item-total correlation of minus 0.623 after reverse-scoring. Removing it by the standard 0.30 threshold lifted the scale to 0.690.
Table 4.3 reports both the initial and the final value for every construct, because showing only the final figure would conceal the diagnostic step that made the scale trustworthy.
Removing items until your alpha looks good sounds like fishing. How is that legitimate?
The rule was fixed in advance rather than chosen afterwards. Items below the conventional 0.30 corrected item-total threshold are removed, worst first, recomputing after each removal, and no scale may drop below 3 items.
Only 2 items in the whole instrument crossed that threshold, and they were exactly the 2 reverse-coded items, in both independent samples. No forward-worded item was touched, and no further removals were made once those two were out.
If I had been fishing, the removals would have been scattered across the instrument. Instead they were confined to the two items with a documented failure mode.
Is 64 responses enough for a regression?
It is enough for what the study claims and not enough for what it explicitly does not claim. With 64 cases and 3 predictors there are roughly 21 cases per predictor, which exceeds the commonly applied minimum of 10 to 15 for stable estimates but falls short of the 50 to 100 per predictor recommended for optimal stability.
So the model is adequately powered to detect a large effect and underpowered for small ones. That is precisely why the non-significant coefficients are reported as a failure to detect a unique effect rather than as evidence that no effect exists.
You defined the dependent variable as having three sub-dimensions but only scored one. Why?
Because the evidence decided. The principal component analysis showed the 4 surviving items forming a single dimension rather than three separable factors.
So it is scored as one unidimensional composite and the three conceptual sub-dimensions are retained as facets of the construct rather than as separately scored subscales. Establishing them as distinct measurable subscales would require a longer instrument with enough items per sub-dimension, and that is a named future recommendation in Chapter 7.
Chapter 4 turns the survey evidence into a specification. It starts with the stakeholder profile, then purifies the instrument, removing the 2 reverse-coded items that failed in both samples, then runs descriptives, correlation and simultaneous regression. All three predictors correlate strongly with the outcome in identical rank order in both samples, but in regression only centralized information access contributes uniquely, at beta 0.665 for travellers and 0.461 for organisers. The thematic analysis of the free-text answers reached the same conclusion independently, with information staleness rather than absence as the primary failure. That produced the design mandate: the unified record is the architectural core, real-time visibility is a read surface over it, and pre-booking is the write path into it.